How to detect slow ACLs
October 25, 2024
Slow access controls (ACLs) might be a significant performance killer in your ServiceNow platform. Especially the READ ones that can make your reports badly performing. There is a reason why ServiceNow Health Scan has a recommendation “Read ACLs should not have GlideRecord/GlideAggregate in script” as this can significantly impact performance.
So how to find the slowest ACLs in your platform?
Go to System Logs > All and search for “Message” starts with “Slow ACL”.

This logging is available in [syslog] table since Washington D.C. release. Previously, it was available only in the Node Log. By default, any ACL running longer than 5ms is logged there. That might generate a bit too many logs in big and customized instances. You can easily end up with hundred thousands logs and thinking how to disable it.
Can I disable these logs?
Yes, you can. By increasing the threshold! If you set big enough number, then you practicaly disable it. However, my recommendation is to set it to 100ms and work on these slowest ACLs actively.
How to increase the threshold for Slow ACLs logging?
Create system property “glide.security.slow_acl_threshold” of type “Integer” and add value in ms (e.g., 100). This property is not documented (October 2024) but it is provided by ServiceNow Support if you ask them how to manage these “Slow ACL” logs.
To speed you up, I have prepared an update set that you can simply import to your non-prod environment. What will you get in it?
- The system property with proper description, and visible under “System Properties > System Diagnostics” for simple accessibility.
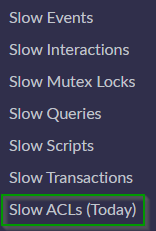
- New module under “System Diagnostics > Slow ACLs (Today)” that enables your admins to quickly access slow ACL logs.

Download for free the update set here (ensure to test first, use at your own risk). Tested in Washington and Xanadu release version:
- Update Set: DominikSimunek-SlowACLs-v1.0 - use import of update set to load it to your non-prod instance.
What to do next with the data?
You can start with exporting the system logs for today or yesterday into Excel and perform analyses. Split the message to get sys_id, ACL path, and time into separate columns. Once you achieve that, you can start counting average time for each ACL to detect the slowest ones, or the ones executed the most frequently. Time to show your Excel skills!
Use Pareto principle and optimize the ACLs where you gain the biggest benefits.
I hope this helps you! Let me know via email about the success you have achieved thanks to optimizing your slowest ACLs!
PS: Last tip, in case you use Data Filtration, there is similar system property "glide.security.slow_df_threshold" that you can create for it.